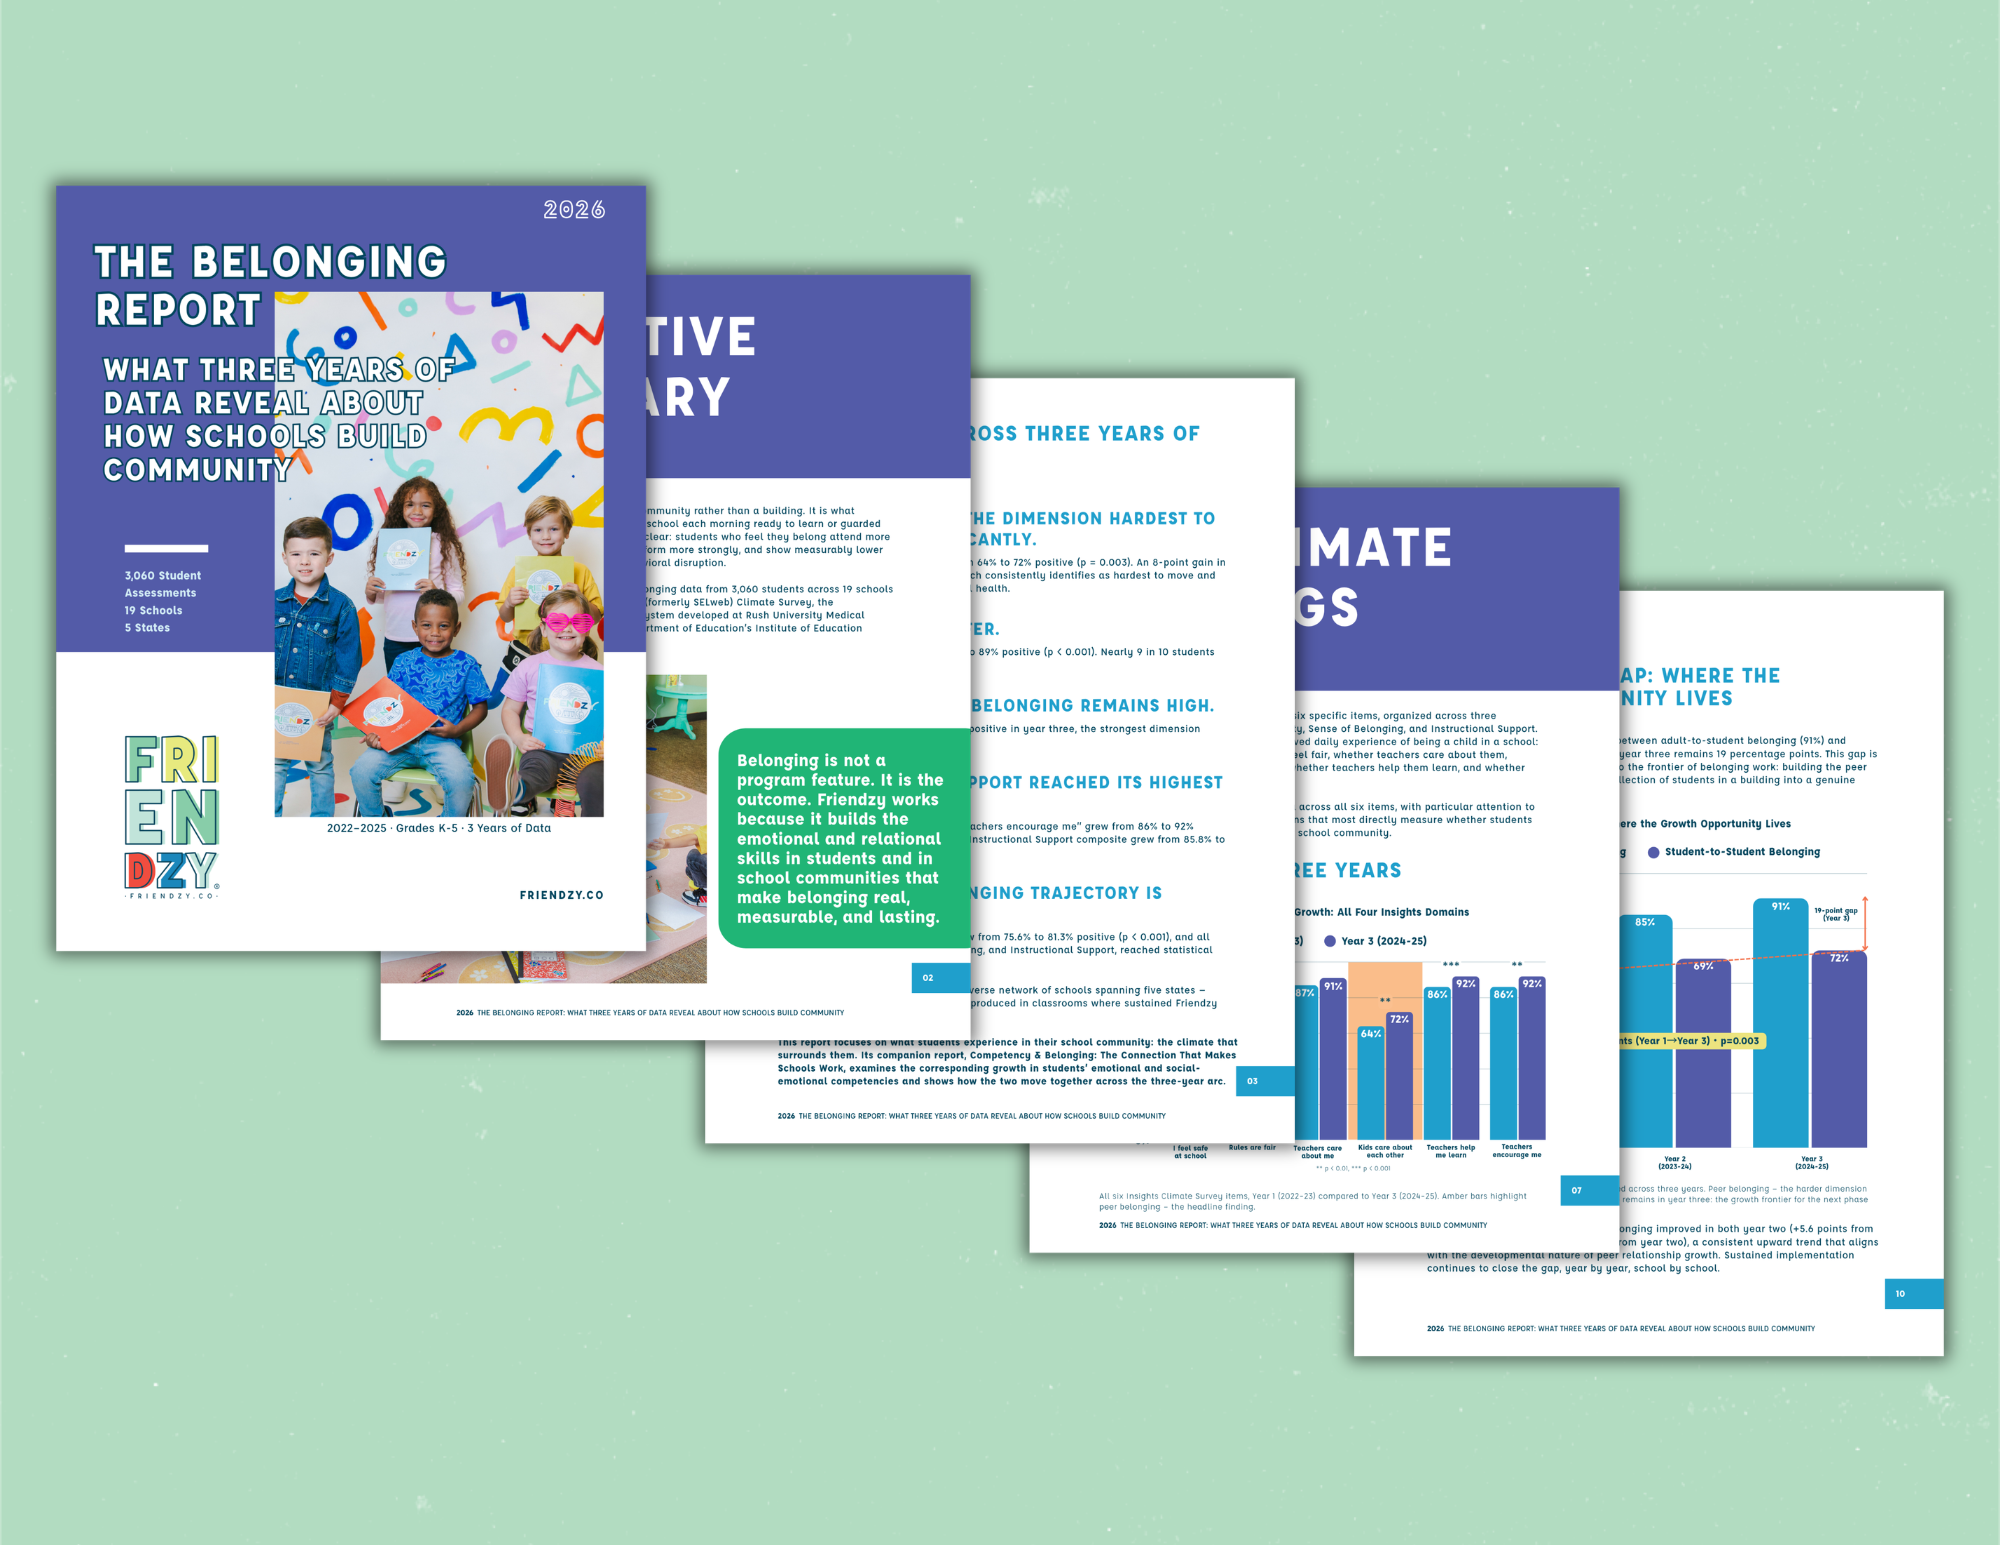
The Belonging Report—discover what three-years of data reveals about how schools build and strengthen classroom community.
Belonging is what makes a school a community rather than a building. Students who feel they belong attend more consistently, engage more deeply, and show lower rates of anxiety and behavioral disruption. Across three years and 19 schools, Friendzy students reported feeling safer, more supported, and more connected to one another, with the steepest gains in the dimension research calls hardest to move.
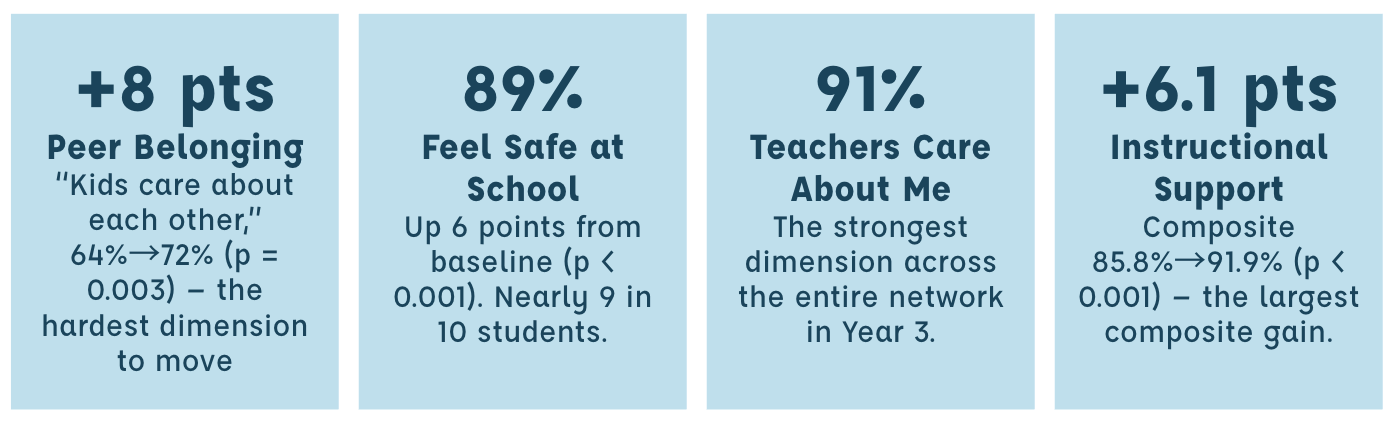 The Insights Climate Survey measures six items across three domains: Safety, Belonging, and Instructional Support. Every measure moved upward over three years, and four of the six reached statistical significance. The entire climate of these schools changed, not one or two isolated items.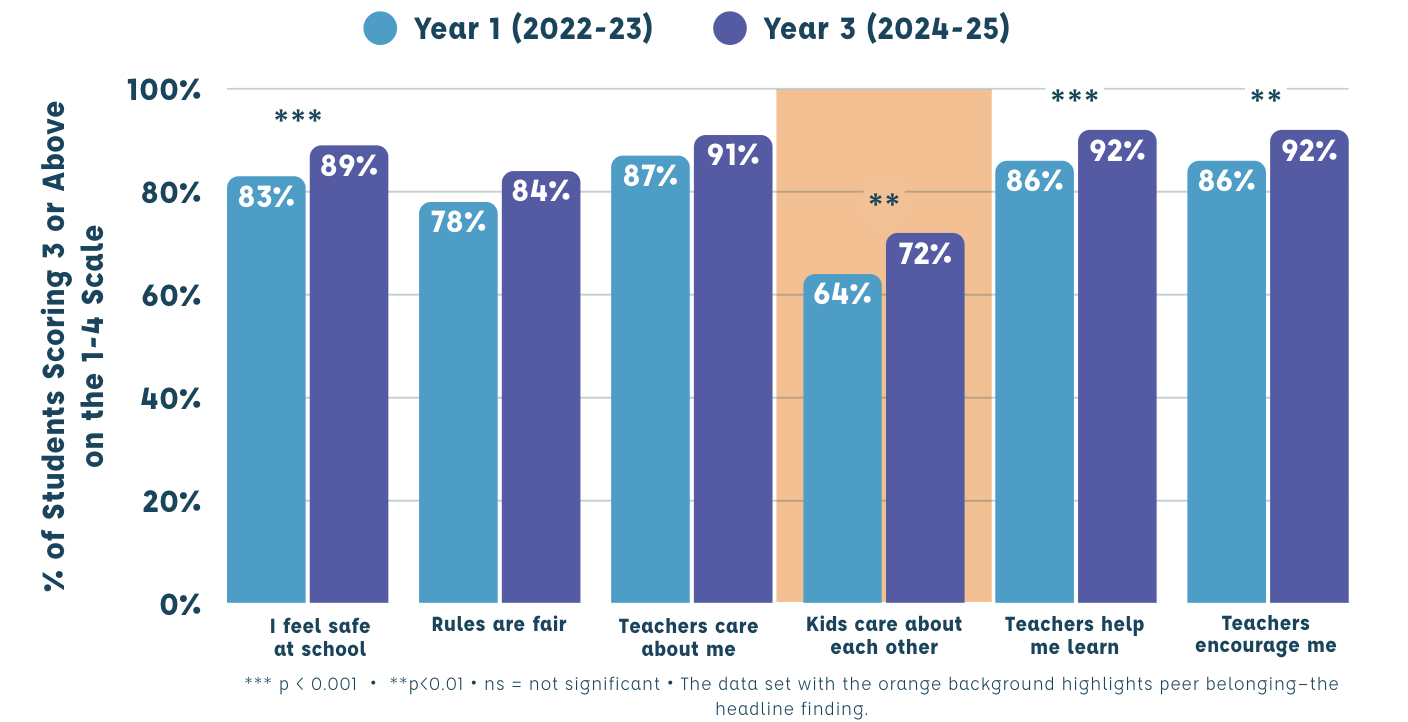
Peer belonging is the climate dimension hardest to move and the one most consequential for student mental health. It does not improve as a side effect of stronger teacher relationships — schools that move it do so through explicit work building the skills that make genuine peer connection possible.
An 8-point gain (p = 0.003) means thousands of students who moved from uncertainty about whether their peers care, to confidence that they do.
All six Insights Climate Survey items, Year 1 (2022–23) compared to Year 3 (2024–25). Amber bars highlight peer belonging—the headline finding. *** p < 0.001 · ** p < 0.01 · ns = not significant.
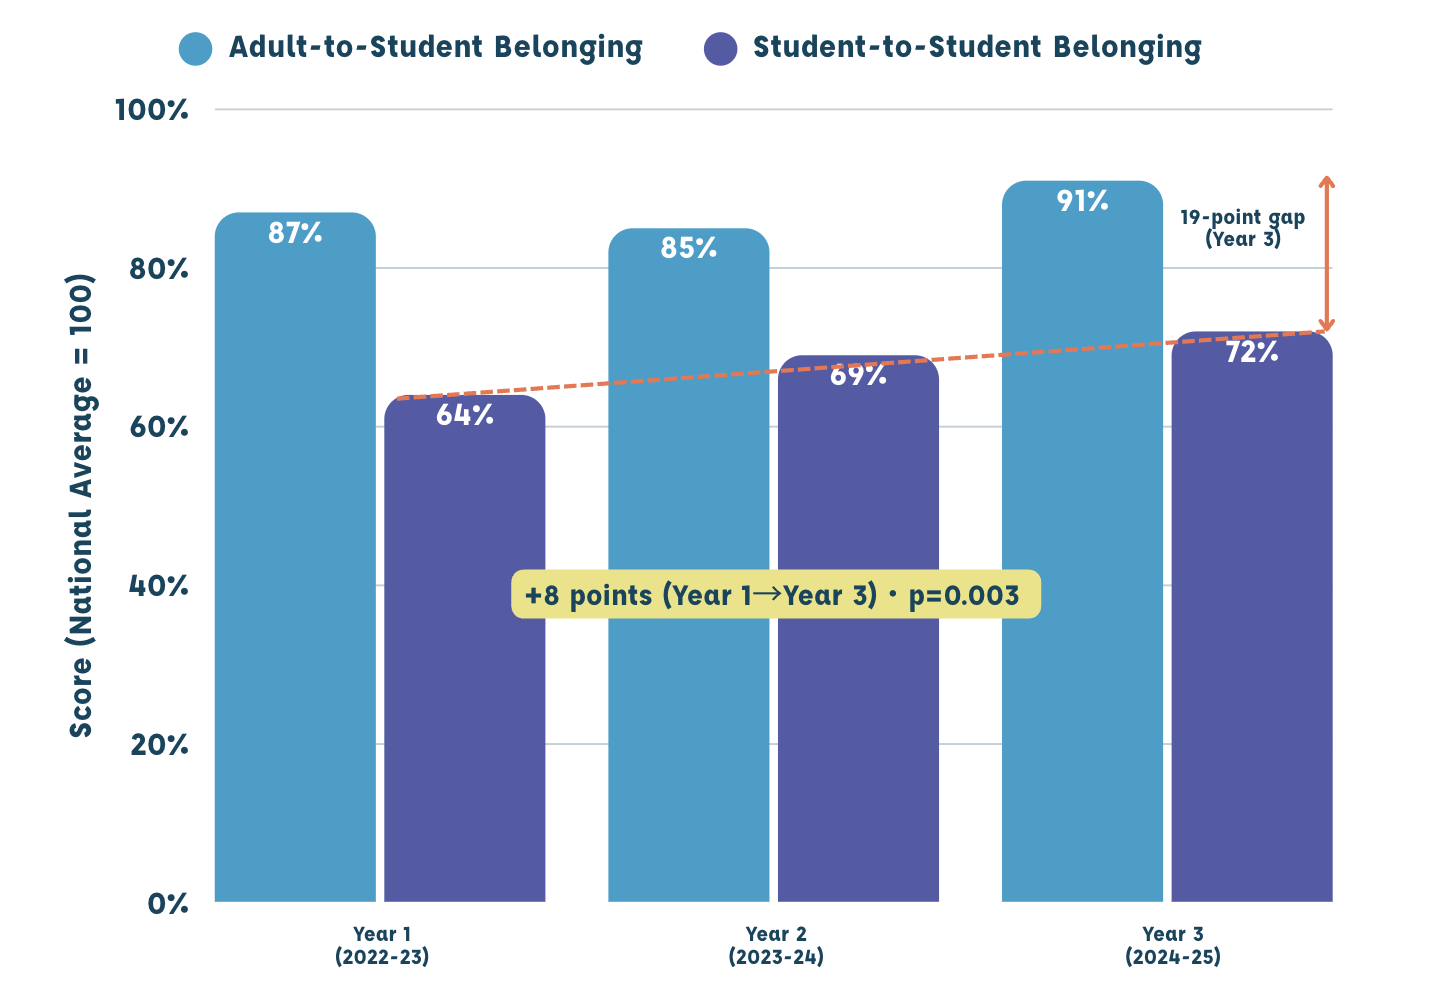
School belonging has two dimensions. Adult-to-student belonging — do the adults here know and care about me? — builds quickly, one classroom at a time, and sits at 91%. Student-to-student belonging — do my classmates care about me? — depends on the norms of an entire community, and reached 72% in Year 3.
The 19-point gap between them is not a failure but a direction: it marks the
frontier of belonging work. The trajectory is encouraging, where peer belonging rose in both Year 2 (+5.6) and Year 3 (+2.7), closing year by year as sustained implementation takes root.
The two dimensions of belonging across three years. Peer belonging gained 8 points; a 19-point gap remains in Year 3 — the growth frontier for the next phase of work.
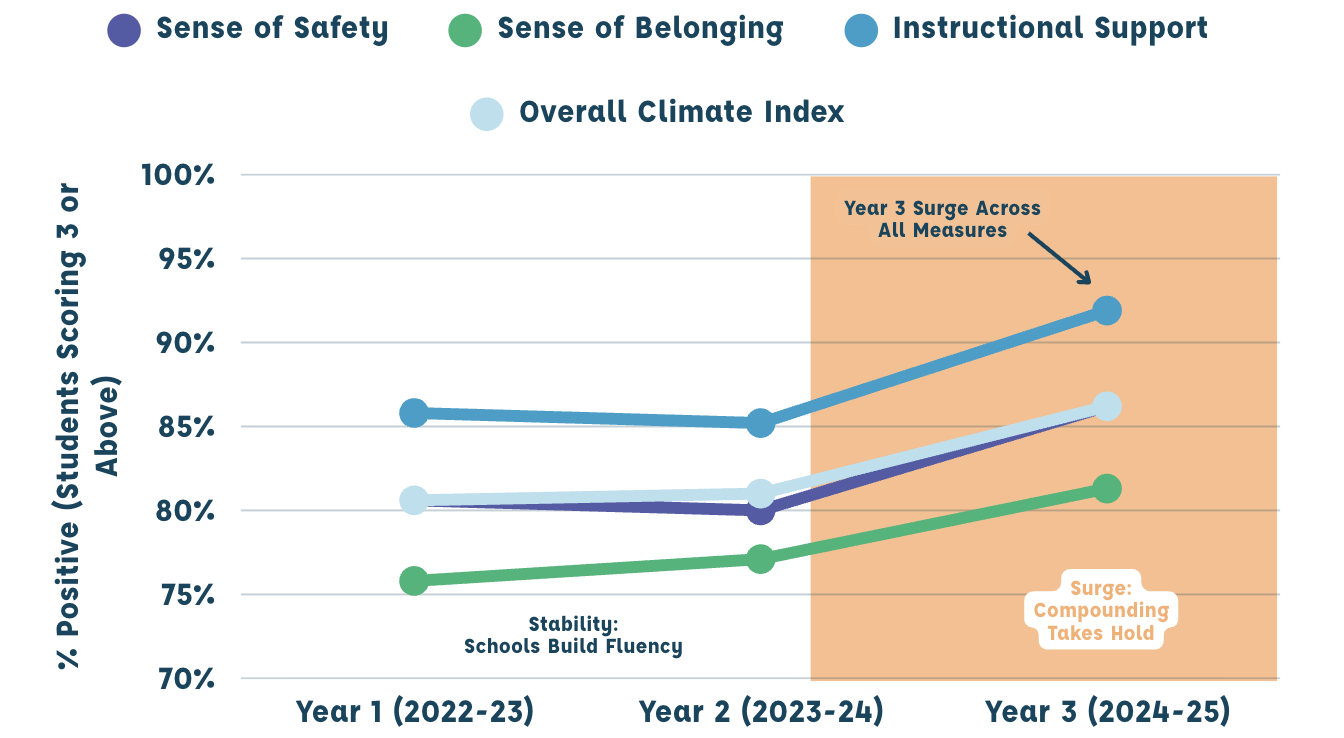
Across every climate measure, the three-year arc follows one pattern. Years one and two hold steady while schools build program fluency and embed new relational norms. Year three surges. This is the compounding effect of sustained implementation: the infrastructure built early becomes the foundation for accelerated growth. All three domains: Safety, Belonging, and
Instructional Support, reached statistical significance from baseline to Year 3.
Schools that pilot Friendzy for a single year and evaluate it on year-one results are measuring the wrong thing. The compounding effect of sustained implementation is what the three-year data reveal.
Three-year trajectories of all three domain composites plus the overall climate index. Stable years 1–2 (schools building program fluency); surge in year 3 (compounding effects of sustained implementation).
Allen, K., Kern, M. L., Vella-Brodrick, D., Hattie, J., & Waters, L. (2018). What schools need to know about fostering school belonging: A meta-analysis. Educational Psychology Review, 30(1), 1–34.
Baumeister, R. F., & Leary, M. R. (1995). The need to belong: Desire for interpersonal attachments as a fundamental human motivation. Psychological Bulletin, 117(3), 497–529.
Durlak, J. A., Weissberg, R. P., Dymnicki, A. B., Taylor, R. D., & Schellinger, K. B. (2011). The impact of enhancing students’ social and emotional learning: A meta-analysis of school-based universal interventions. Child Development, 82(1), 405–432.
Korpershoek, H., Canrinus, E. T., Fokkens-Bruinsma, M., & de Boer, H. (2020). The relationships between school belonging and students’ motivational, social-emotional, behavioural, and academic outcomes. Research Papers in Education, 35(6), 641–680.
McKown, C., Russo-Ponsaran, N. M., Johnson, J. K., Russo, J., & Allen, A. (2016). Web-based assessment of children’s social-emotional comprehension. Journal of Psychoeducational Assessment, 34(4), 322–338.
Thapa, A., Cohen, J., Guffey, S., & Higgins-D’Alessandro, A. (2013). A review of school climate research. Review of Educational Research, 83(3), 357–385.
Wentzel, K. R., & Ramani, G. B. (Eds.). (2016). Handbook of social influences in school contexts. Routledge.
Insights (formerly SELweb) Climate Survey · xSEL Labs · % positive = students scoring 3 or above on a 1–4 scale. Independent-samples t-tests (Welch’s correction), Year 1 vs Year 3; Cohen’s d effect sizes; Mann-Whitney U robustness checks. Schools self-selected into multi-year implementation; findings describe what sustained implementation makes possible rather than causal effects versus a control group.