How student skill development and school climate move together.
School climate does not improve by accident. Behind every shift in how students experience school is a shift in what students are able to do. When a child can recognize others’ emotions, take another’s perspective, control impulses, and solve social problems, the relational environment changes. Measured by direct, performance-based assessment, not self-report. Friendzy students grew on all four competencies, and that growth tracks tightly with the climate they experience.
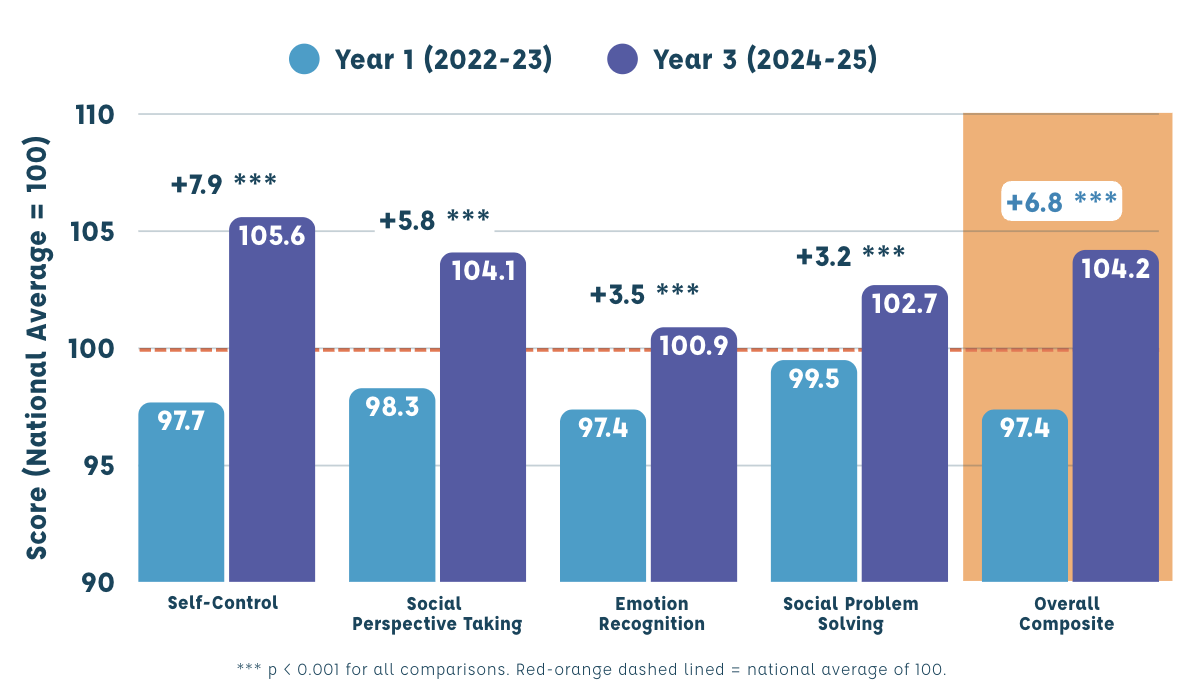
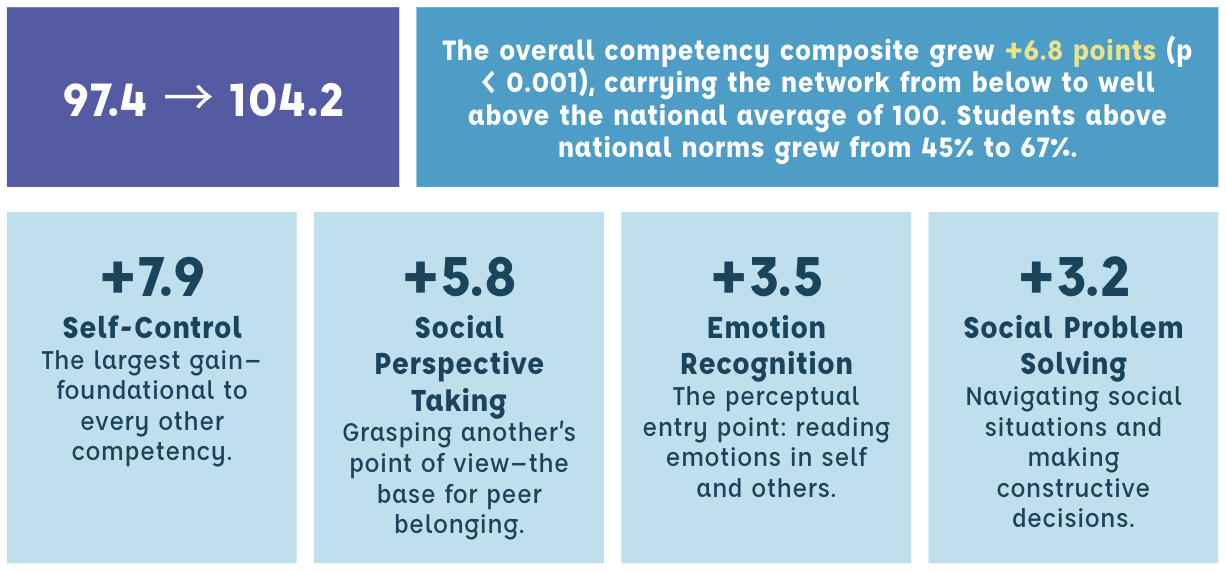 Combining Early (K–3) and Late (4–5) Elementary students, the network shows statistically significant growth across all four competency domains (all p < 0.001).
The shift is not just an average effect but it reflects a genuine change in the distribution. Students scoring “Above Expectations” on the composite more than tripled (7.0% → 21.9%), while those “Below Expectations” fell from 21.7% to 12.5%. Friendzy lifts the floor while raising the ceiling.
All four Insights competency domains plus the overall composite, Year 1 baseline vs Year 3. Amber dashed line = national average of 100. The network moved from below to above the national average across all four domains. *** p < 0.001.
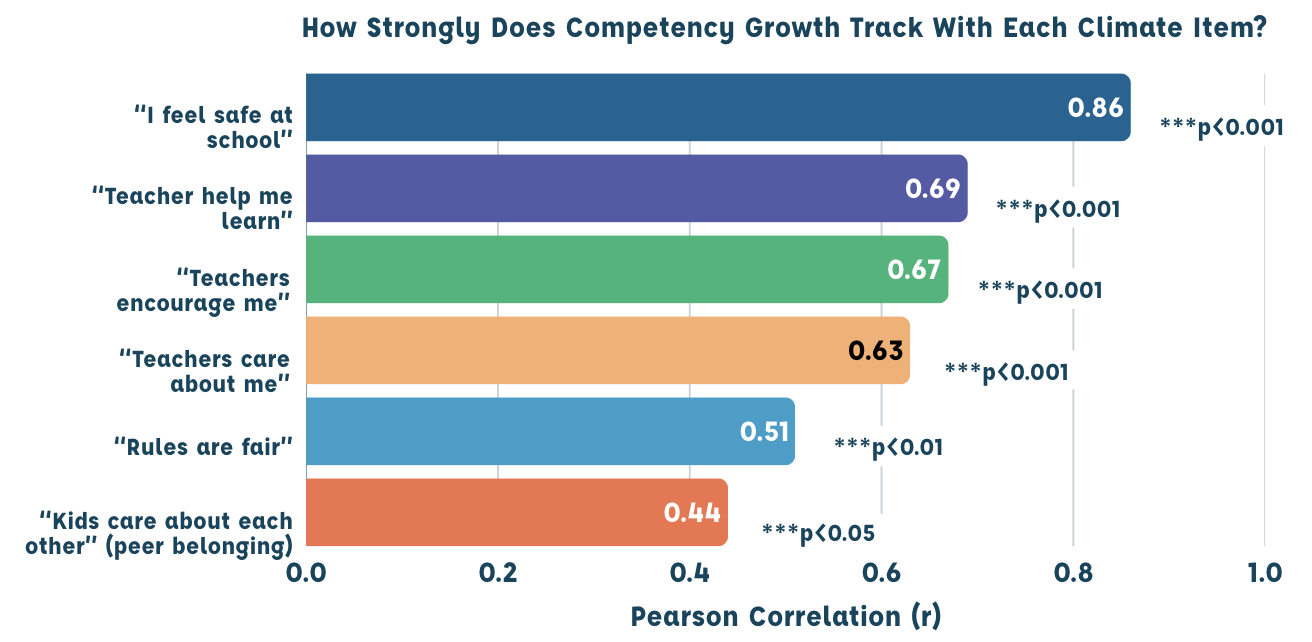
The most important result is what happened when we looked at skills and climate together. Aggregated at the school level and correlated across 19 schools and three years, competency growth is significantly associated with every one of the six climate items. Schools where students develop stronger skills are schools where
students feel safer, more cared for, and more supported.
Safety tracks competency most tightly (r = 0.86) — when students can recognize emotions, take perspective, and resolve conflict, the environment is genuinely safer. Adult-relationship items follow closely (r = 0.63–0.69). Peer belonging (r = 0.44) is the weakest but still significant: skills are necessary for peer culture, but peer norms take the longest to shift.
Competency growth predicts climate growth at the school level. Where students develop the skills, the climate develops with them.
Pearson correlations between the competency composite and each climate item, across 19 schools and 3 years (n = 53 school-year aggregates). Safety shows the strongest relationship at r = 0.86.
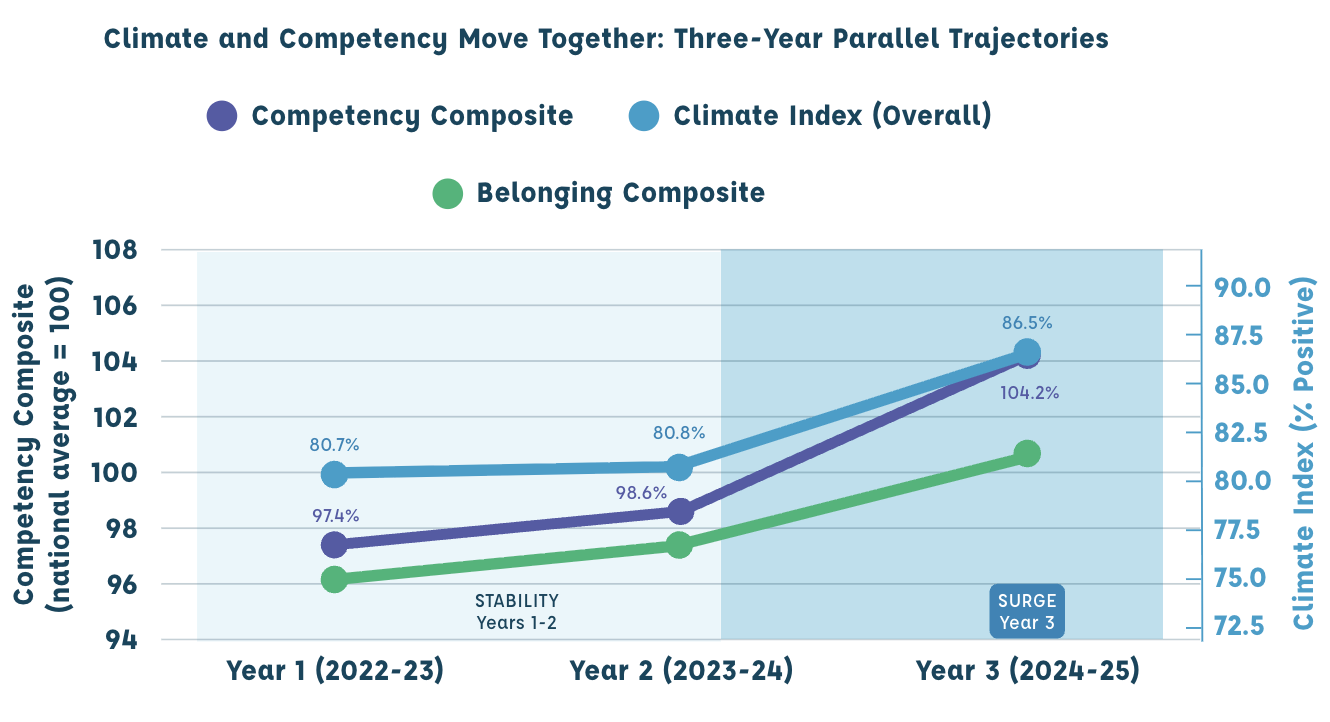
Skills and climate trace the same three-year arc: relative stability while schools build fluency, then a surge in year three as sustained practice compounds. Two measurement systems, one pattern—the virtuous cycle made visible.
Students Build Skills: Emotion recognition, perspective-taking, self-control, problem solving.
Relationships Deepen: Empathy, peer care, and constructive norms emerge.
Climate Strengthens: Safety, belonging, and support perceptions rise.
Three-year trajectories of the competency composite (left axis) and climate measures (right axis). Different scales, parallel movement: stability in Years 1–2, surge in Year 3.
Cipriano, C., Strambler, M. J., Naples, L. H., Ha, C., Kirk, M., Wood, M., et al. (2023). The state of evidence for social and emotional learning: A contemporary meta-analysis of universal school-based SEL interventions. Child Development, 94, 1181–1204.
Durlak, J. A., Weissberg, R. P., Dymnicki, A. B., Taylor, R. D., & Schellinger, K. B. (2011). The impact of enhancing students’ social and emotional learning: A meta-analysis of school-based universal interventions. Child Development, 82(1), 405–432.
Greenberg, M. T. (2023). Evidence for social and emotional learning in schools. Learning Policy Institute.
Lawson, G. M., McKenzie, M. E., Becker, K. D., Selby, L., & Hoover, S. A. (2019). The core components of evidence-based social-emotional learning programs. Prevention Science.
McKown, C. (2019a). Reliability, factor structure, and measurement invariance of a web-based assessment of children’s social-emotional comprehension. Journal of Psychoeducational Assessment, 37(4), 435–449.
McKown, C. (2019b). Challenges and opportunities in the applied assessment of student social and emotional learning. Educational Psychologist, 54(3), 205–221.
McKown, C., Russo-Ponsaran, N. M., Johnson, J. K., Russo, J., & Allen, A. (2016). Web-based assessment of children’s social-emotional comprehension. Journal of Psychoeducational Assessment, 34(4), 322–338.
Insights standard scores benchmarked to national norms (100 = national average). Paired analysis of Year 1 vs Year 3 school means; Cohen’s d effect sizes; school-level Pearson correlations across 53 school-year aggregates. Correlation does not establish causation, and self-selected multi-year implementation may introduce selection effects.